Posted on Oct 23, 2023, 08:08 by Dave Toth
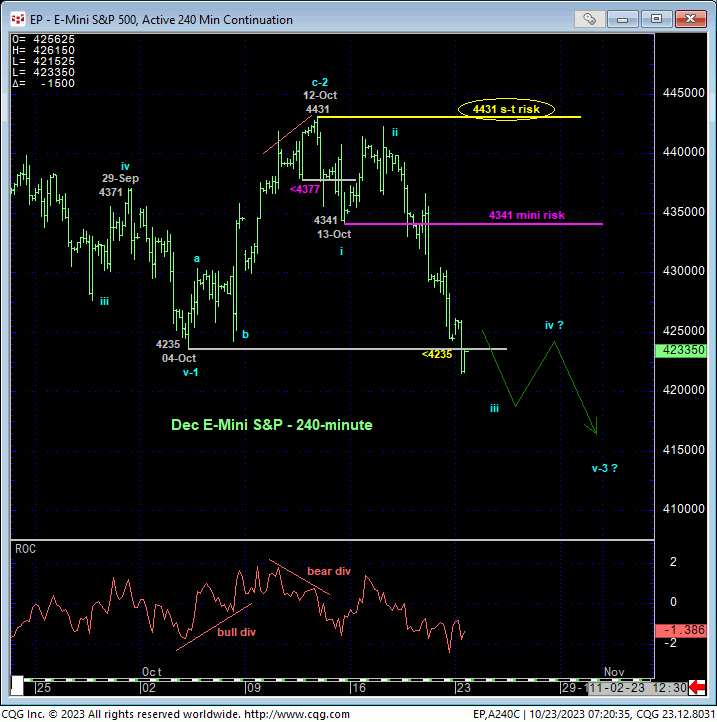
Thur/Fri’s accelerated decline and today’s break below 04-Oct’s key 4235 low reaffirms our bearish count and recommendation discussed most recently in 12-Oct’s Trading Strategies Blog and leaves 12-Oct’s 4431 high in its wake as the end of the (suspected 2nd-Wave) correction within a broader (5-wave) impulsive sequence down from 27-Jul’s 4635 high that could have very long-term bearish implications. Per such, this 4431 level serves as our new short-term parameter from which shorter-term traders can objectively rebase and manage the risk of a continued bearish policy and exposure.
On an even shorter-term basis detailed in the 240-min chart below, 13-Oct’s 4341 low is considered a smaller-degree 1st-wave of an eventual 5-wave sequence down from 4431 that we would NOT expect this market to recoup per this more immediate bearish count. In this regard, this 4341 level serves as our new mini parameter from which shorter-term traders can also manage the risk of a bearish stance.
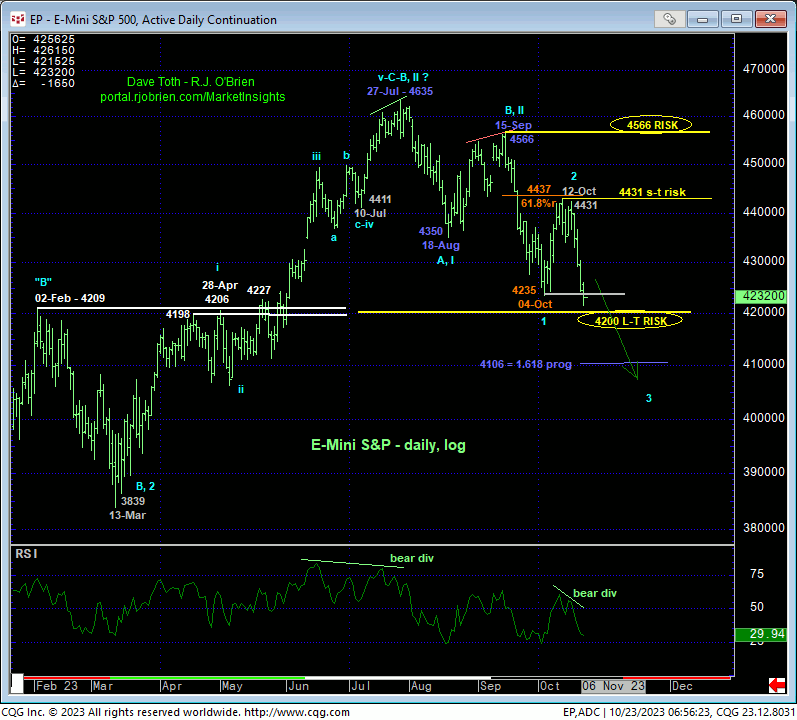
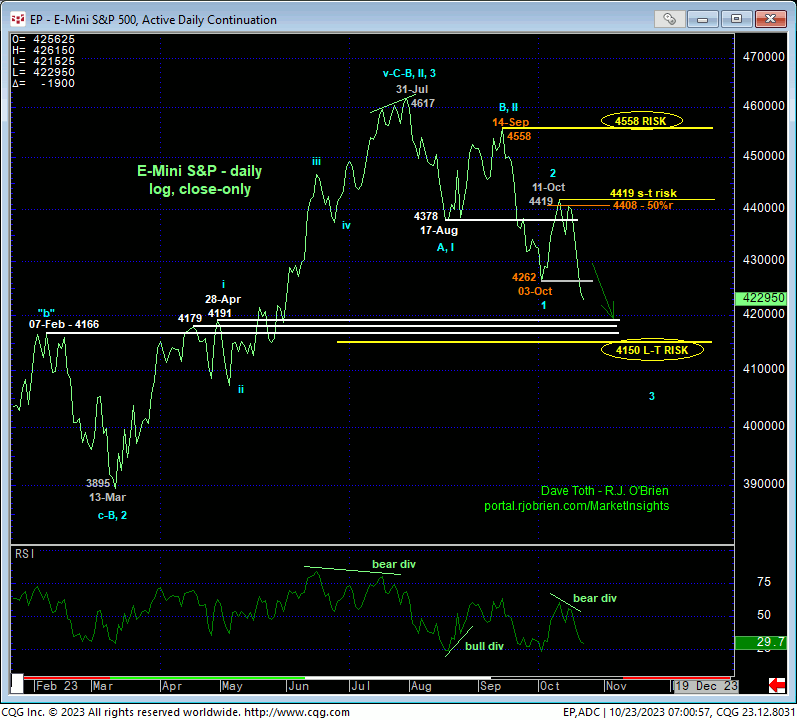
The daily log bar chart above and close-only chart below show Fri/today’s break below 03/04-Oct’s lows that reaffirm our major peak/reversal count introduced in 02-Aug’s Technical Blog that leaves smaller- and larger-degree corrective highs in its wake at 4431 and especially 15-Sep’s 4566 high that this market MUST now recoup to diffuse a peak/reversal -threat environment that we believe could be major in scope.
These charts also show one remaining bastion of prospective resistance-turned-support from the 4225-to-4150-area from Feb-thru-May that, since demolished in Jun’s rally, this market would/should be expected to “hold” above IF IF IF the past quarter’s sell-off attempt is a correction within a longer-term bullish count. A break below this area would render the entire recovery from Oct’22’s 3502 low a 3-wave and thus corrective structure that would then be expected to re-expose Jan-Oct’22’s major downtrend that preceded it. Herein lies the importance of the new bear risk parameters at 4341 and especially 4431 above which we can objectively navigate a reversal higher and pare/neutralize bearish exposure.
On a broader scale, the weekly chart below better shows the significance of the entire 4225-to-4150-area as a key support candidate that must hold per any alternate bullish count. If Oct’22 – Jul’23’s uptrend hasn’t been broken yet, a break below this 4225-to-4150-area will certainly confirm the reversal and remove that final technical reason anyone would/should want to remain long equities. For be then rendering Oct’22 – Jul’23’s a 3-wave and thus (B- or 2nd-Wave) correction of Jan-Oct’22’s initial (A- or 1st-Wave) counter-trend decline, we would expect a dramatic (C- or 3rd-Wave) plunge to AT LEAST the lower recesses of the past 20-month range and possibly a major bear market meltdown below 3500. And again, to defer or diffuse this broader bearish count, all the market needs to do is start showing some strength above the specific and objectively risk parameters we’ve defined above starting with 4341, 4431 and then 4566. Until and unless such strength is proven, and especially if this current downtrend accelerates below the 4200-area, steep and potentially relentless losses should not surprise straight away.
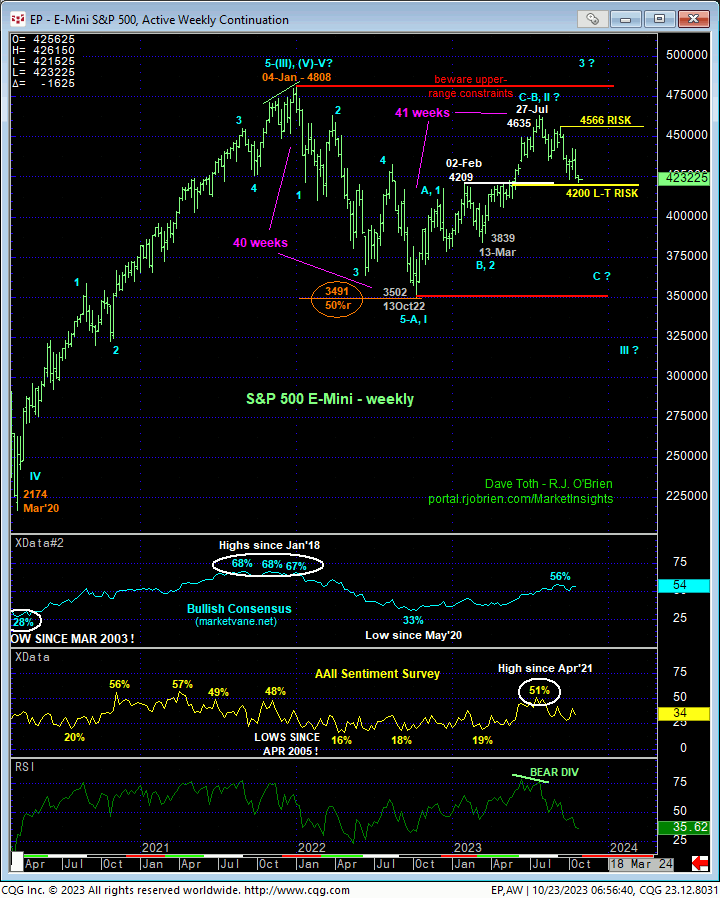
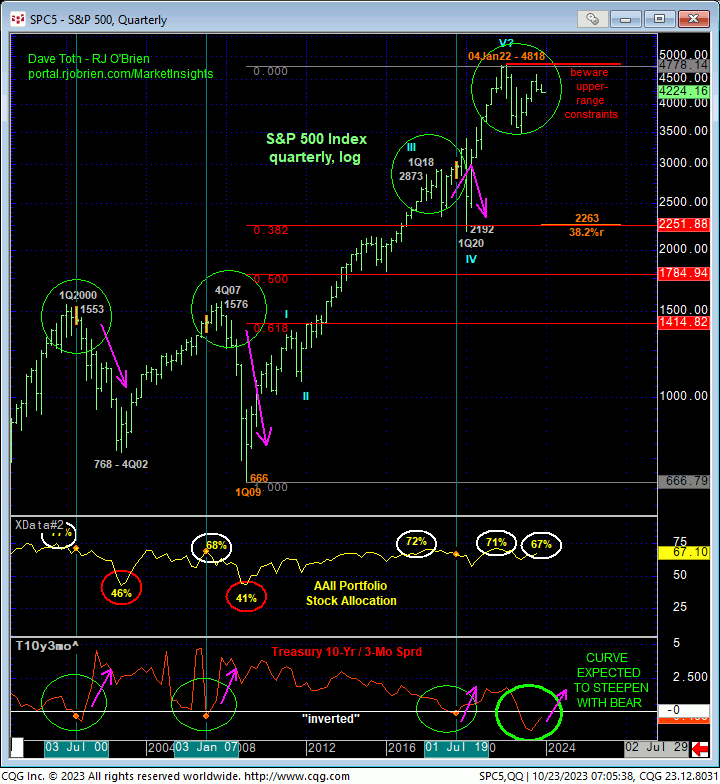
Lastly and on an even broader scale shown in the monthly log chart below, we’ve discussed repeatedly over the past 20 months of the grossly inverted Treasury yield curve as a “leading” indicator of a peak/reversal/bear market threat along with a bearish divergence in monthly momentum in Jan/Feb’22, historically extreme bullish sentiment and a complete and major 5-wave Elliott sequence up from AT LEAST Mar’20’s 2192 low and possibly from the 2009 low way down at 666. As with the past three cases this millennium that such an inverted yield curve warned of and then confirmed a major correction or reversal lower, this yield curve will be expected to return to a more normal upward slope as the bear market in equites takes hold due to a quality-flight exodus from stocks to fixed income.
These issues considered, a bearish policy and exposure remain advised with a recovery above at least 4341 and preferably 4431 required to defer or threaten this call enough to warrant paring or neutralizing exposure. In lieu of such strength, and especially if this market breaks the 4225-to-4150-area in the weeks immediately ahead, steep, accelerated losses will be expected in a resumption of 2022’s major bear market that we believe will sight at least the 3800-to-3500 lower-quarter of the past 20-month range and possibly the resumption of a major bear market below 3500.
